Most advertisers pay between $0.40 and $1.80 per click, $6 to $10 per thousand impressions, and $15 to $60 per acquisition on Instagram in 2026, though your actual numbers depend heavily on placement and creative quality. The one rule that matters more than any benchmark: budget enough to exit Meta’s learning phase, typically 50 conversions per ad set within a week, before judging whether a campaign works. Everything below breaks down the ranges by metric, placement, and industry, plus how to cut your costs once you have real data.
TL;DR:
- A budget of $300 to $500 per month is sufficient for initial testing, but drastically underfunded accounts risk misjudging campaign potential.
- Creatives, especially hooks in Reels, have the highest impact on ad costs and conversions, making creative testing critical during early campaigns.
- Broad audiences generally result in lower costs per thousand impressions compared to interest stacks, while lookalike audiences often outperform interest targeting.
- Seasonality, campaign objective, placement, and landing page quality significantly influence CPM, CPC, and CPA, requiring ongoing optimization and data analysis.
- Larger budgets above $2,000 monthly are suitable only for mature accounts with steady conversion volume and enough data to optimize manual bidding strategies.
Table of Contents
- Key Takeaways for Planning Your Instagram Ad Budget
- How Much Do CPC, CPM, CPE, and CPA Actually Run?
- What Actually Drives Your Instagram Ad Costs Up or Down?
- How Do Reels, Feed, Stories, and Advantage+ Compare?
- What’s a Realistic Instagram Ad Budget by Stage?
- How Do You Lower CPM, CPC, and CPA Without Guessing?
- What Industry Benchmarks Should You Compare Against?
- Who’s Behind This Instagram Ad Cost Analysis?
- Is the Conventional Advice on Instagram Ad Spend Wrong?
- Let Courimo Handle Your Instagram Ad Strategy
- Sources
Key Takeaways for Planning Your Instagram Ad Budget
If you only have two minutes, here’s what to walk away with before you open Ads Manager.
- Cost per click typically runs $0.40 to $1.80, with well-optimized accounts landing closer to $0.40 to $0.70.
- Cost per thousand impressions (CPM) averages $6 to $10, though efficient ad sets can dip to $2 to $6.
- Cost per acquisition varies by industry but commonly falls between $15 and $60.
- Set a minimum test budget of $300 to $500 per month and let campaigns run at least 5 to 7 days before making changes.
- Reels costs less per impression and suits discovery; Feed costs more but converts better for direct sales; Stories sits in between and works well for retargeting.
- If you’re spending more than $2,000 a month without a clear cost-per-result target, or you don’t have time to test creative weekly, that’s the point to talk to an agency instead of guessing.
How Much Do CPC, CPM, CPE, and CPA Actually Run?
Four metrics decide whether your Instagram ad budget stretches or evaporates: cost per click (CPC), cost per thousand impressions (CPM), cost per engagement (CPE), and cost per acquisition (CPA). Each one tells you something different, and confusing them is the fastest way to misjudge a campaign that’s actually working fine.
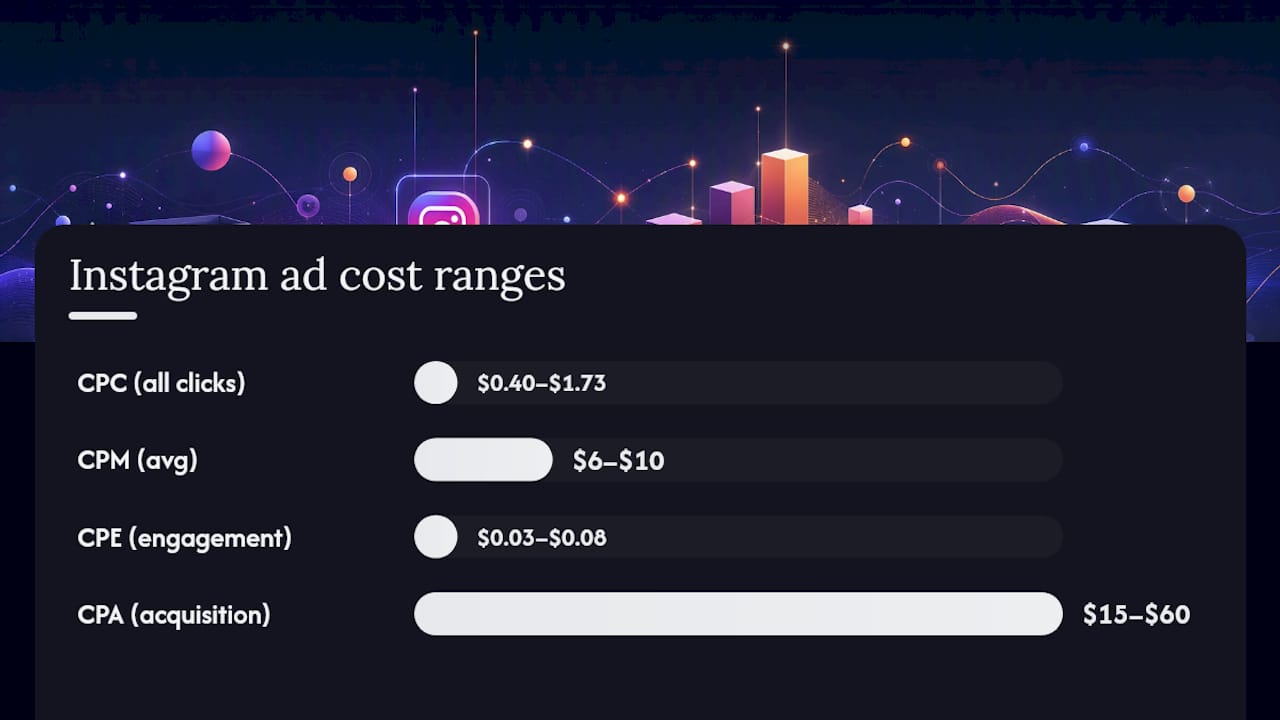
CPC measures what you pay every time someone clicks. Published ranges commonly land between $0.40 and $1.73 for all clicks, with clicks to your actual website or landing page (called “link clicks” or destination clicks) running a bit higher than that because Meta counts every tap, including profile visits, in the cheaper “all clicks” bucket. If your CPC sits below $0.70, you’re in strong-performance territory for most industries.
CPM tells you what a thousand impressions cost, regardless of clicks. Meta’s own placement mix affects this heavily. Expect $6 to $10 on average, though efficient, well-targeted campaigns using Reels can drop to $2 to $6. Seasonality moves this number too. CPMs climb every November and December as retailers flood the auction ahead of the holidays, then ease off in January and February.
CPE, cost per engagement, covers likes, comments, saves, and shares on an ad. It’s cheap by nature. WordStream reports $0.03 to $0.08 per engagement for ad sets built around brand awareness. This metric matters more for brand campaigns than for anyone trying to drive purchases.
CPA is the number that actually decides profitability. It ranges widely by industry, commonly $15 to $60 per action, but “action” itself needs a definition before that number means anything. A $50 CPA is expensive for an email signup and cheap for a $400 product purchase.
A few caveats matter here. These ranges reflect broad industry reporting, not a guarantee for your account. A fitness apparel brand running Reels ads to a warm retargeting audience will beat these numbers easily. A B2B software company running cold Feed traffic to a demo request form will often exceed them, and that’s not a sign the campaign is broken.
- Treat the lower bound of each range as your optimization goal, not your starting expectation.
- Treat the upper bound as your conservative budgeting ceiling when forecasting spend.
- Recalculate every 2 to 3 weeks once you have enough data to spot real trends versus daily noise.
What Actually Drives Your Instagram Ad Costs Up or Down?
Instagram ads run on an auction, not a price tag. Meta’s system ranks every eligible ad using three factors: your bid, the ad’s estimated action rate (how likely a specific person is to do what you want), and ad quality. That middle factor, predicted action rate, is why two advertisers targeting the same audience can pay wildly different amounts. The system rewards ads it believes people will actually respond to, so a boring ad effectively pays a penalty even before it appears.
Your campaign objective sets the baseline. Awareness campaigns optimize for cheap reach and produce low CPMs. Conversion campaigns ask Meta to find people likely to buy, which narrows the eligible audience and raises cost per result. You’re not paying more because conversion campaigns are inherently pricier. You’re paying more because you’ve asked the system to do harder work.
Audience size cuts the other way from what most advertisers assume.
- Broad, unstacked audiences often cost 20% to 35% less per thousand impressions than narrow, interest heavy audiences, because Meta’s algorithm finds efficient delivery paths on its own.
- Stacking five or six interests to “get specific” usually shrinks your pool and raises your CPM instead of improving relevance.
- Lookalike audiences built from real customer data usually outperform interest targeting at a similar or lower cost.
Creative quality has the single biggest leverage on cost of anything on this list. The first one to two seconds of a Reels ad decide whether Meta’s system classifies it as high or low action rate, and that classification follows the ad for its entire run. A weak hook doesn’t just cost you views. It raises your effective CPM for the life of the campaign because the auction is actively penalizing low engagement.
Seasonality and competition move in the same direction almost every year. Retail and ecommerce brands see CPMs spike from mid November through December as everyone bids for the same holiday shoppers. Finance and legal verticals face steep competition year round simply because the value of a converted customer is high enough to justify aggressive bidding.
Landing page quality affects CPA specifically, not CPM or CPC. A slow-loading page or a checkout flow with five extra steps can double your cost per acquisition even when your ad itself performs beautifully. Meta measures the click. Your website decides whether that click turns into a sale.
How Do Reels, Feed, Stories, and Advantage+ Compare?
Placement changes both what you pay and what kind of behavior you’re buying. Instagram’s 3 billion monthly active users generate enormous inventory across Reels, Feed, and Stories, and that inventory doesn’t behave the same way in the auction.
Reels typically runs the cheapest CPM of the three, often 30% to 50% below Feed, because the format has grown so quickly that supply has outpaced advertiser demand. That cost advantage comes with a catch. People scrolling Reels are in discovery mode, not shopping mode, so conversion campaigns aimed at Reels often post a higher CPA than the same campaign running on Feed, even with a cheaper CPM.
Feed costs more per impression but tends to deliver stronger purchase intent. Someone stopping mid scroll on their main Feed has already slowed down, which correlates with a higher likelihood of clicking through with intent to act, not just to browse.
Stories sit in the middle on both cost and intent, making the format useful for sequential messaging, like a two ad retargeting sequence, or for warming up an audience before a Feed or Reels conversion push.
| Placement | Relative CPM | Best Use Case | Conversion Behavior |
|---|---|---|---|
| Reels | Lowest | Discovery, brand awareness | Higher CPA on cold traffic |
| Feed | Highest | Direct conversions | Stronger purchase intent |
| Stories | Middle | Retargeting, sequential ads | Solid for warm audiences |
| Advantage+ placements | Blended | Mature accounts with volume | 10–20% lower CPA, less control |
Advantage+ placements let Meta’s system distribute your budget across all placements automatically, chasing whichever delivers the best result at any given moment. In mature accounts with steady conversion volume, this can cut CPA by 10% to 20% simply because the algorithm has enough data to allocate spend intelligently. Accounts converting fewer than 50 times a week usually see the opposite effect. Not enough data means the system guesses, and manual placement control tends to outperform automation until volume catches up.
What’s a Realistic Instagram Ad Budget by Stage?
Budget planning on Instagram breaks into three practical tiers, and the mistake most first-time advertisers make is jumping straight to tier two before tier one has taught them anything.
- Starter test budget: $300 to $500 per month. This buys enough impressions and clicks to identify which creative and audience combinations show early promise, without spending enough to hurt if the first attempt flops.
- Mid-tier scaling budget: $1,000 to $2,000 per month. Once you’ve found a winning ad set, this range gives Meta’s algorithm enough conversion volume to optimize delivery and exit the learning phase reliably.
- Growth budget: $5,000 and up per month. At this level you’re usually running multiple ad sets and creative variants simultaneously, and the math starts to favor dedicated management over occasional check ins.
Meta recommends daily budgets as low as $5 for testing, but that figure is a technical minimum, not a practical one. A $5 daily budget rarely generates enough data in a week to tell you anything useful. Lifetime budgets work better for campaigns with a fixed end date, like a product launch; daily budgets suit ongoing programs you plan to keep running and adjusting.
Split spend by funnel stage rather than dumping everything into one conversion campaign:
- Roughly 20% toward awareness or reach, building the audience pool you’ll retarget later.
- Roughly 30% toward consideration, warming people who’ve engaged but haven’t bought.
- Roughly 50% toward conversion, targeting people already warm from retargeting or lookalike data.
A sudden jump resets Meta’s delivery optimization and can spike your costs right when you’re trying to grow. Rotate creative every 7 to 10 days regardless of performance, because even a strong ad eventually fatigues the same audience and costs start climbing on their own.
How Do You Lower CPM, CPC, and CPA Without Guessing?
Cutting Instagram ad costs comes down to running deliberate experiments instead of tweaking settings at random.
Start with creative, since it carries the most leverage. Test three to five hook variations for the first one to two seconds of every Reels ad, since that opening moment determines Meta’s predicted action rate for the entire ad. Vary length too. A 15 second version and a 30 second version of the same concept often perform differently even with an identical hook.
On audiences, start warm before going cold. Retarget people who’ve visited your site or engaged with your Instagram profile first, since that audience converts at a lower cost than anyone who’s never heard of you. Once a warm audience shows a working formula, build a lookalike from your actual customer list. Broad, unstacked targeting frequently beats narrow interest stacks on cost, so resist the urge to over-specify.
Bidding strategy matters less than most advertisers assume, but it’s not irrelevant. Start every new campaign on automatic bidding, since Meta’s algorithm generally finds efficient delivery faster than manual bid caps in the early stages. Once an account has enough historical conversion data, usually a few hundred conversions, manual bid caps or cost caps can squeeze out a lower CPA. Advantage+ campaigns tend to work best for accounts with that same maturity and steady volume.
- Rotate creative every 7 to 10 days to stay ahead of audience fatigue.
- Pause any ad below a 1% click-through rate after it has spent at least $50, rather than waiting for a full week to confirm it’s underperforming.
- Track CTR, conversion rate, and CPA weekly, not just at campaign end.
- Calculate cost per lead by multiplying CPC by the inverse of your landing page conversion rate, giving you a forecast before a single lead comes in.
Pro Tip: Build a simple spreadsheet that multiplies your current CPC by your landing page’s historical conversion rate. That single formula tells you your projected cost per lead before you’ve spent a dollar on a new campaign, and it catches a broken landing page faster than staring at Ads Manager.
What Industry Benchmarks Should You Compare Against?
Raw platform metrics only matter once you translate them into business numbers. The formula is straightforward: CPC drives traffic, your landing page conversion rate turns traffic into leads or sales, and dividing CPC by that conversion rate gives you cost per acquisition.
Benchmarks vary by vertical because average order value and buyer intent vary just as much.
Use these ranges as decision triggers, not just reference points. If your CPA sits comfortably below your vertical’s range after a full week of spend, scale the budget. If it’s tracking near the top of the range, rework the creative or landing page before increasing spend further. If it’s blown past the range with no signs of improving over two full weeks, pause the ad set and rebuild rather than continuing to feed it.
Who’s Behind This Instagram Ad Cost Analysis?
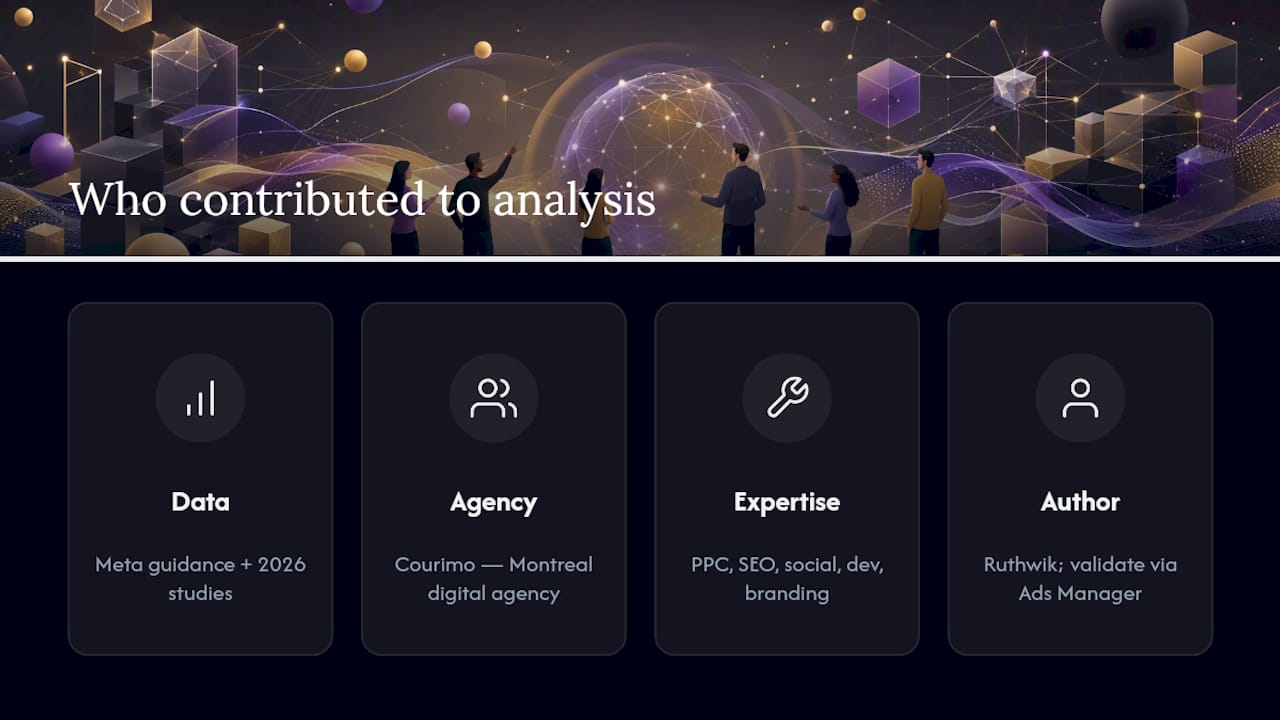
This guide draws on current industry benchmark data and Meta’s own published guidance on auction pricing and budget mechanics, cross referenced against multiple 2026 cost studies to avoid relying on a single source’s numbers.
Courimo is a Montreal based digital marketing agency built around SEO, pay per click advertising, web development, social media strategy, and branding, with a specific focus on measurable results rather than vanity metrics. The agency’s work includes campaign management across platforms and operational experience running budgets against conversion targets shapes the benchmarks and thresholds outlined above. The agency’s track record includes client case studies and ROI improvements across sectors, which is the same standard this article applies to every claim: does the number hold up when real money is behind it.
This piece was written by Ruthwik, drawing on current platform data, published industry benchmarks, and practical campaign management principles used across small and medium business advertising accounts. Readers looking to validate any of these figures against their own account performance can compare their Ads Manager reporting directly against the ranges above, ideally after at least two weeks of consistent spend.
Is the Conventional Advice on Instagram Ad Spend Wrong?
Most guides treat CPM and CPC benchmarks like a report card, and that’s the wrong way to use them. A campaign sitting above the “average” CPM isn’t automatically failing, and one sitting below it isn’t automatically winning. What actually predicts success is whether your CPA, once you account for your specific conversion rate and product margin, leaves room for profit.
The advice I’d push back on hardest is the obsession with cheap CPMs. A $3 CPM on Reels feels like a win until you notice the CPA is double what you’d get from a $9 CPM on Feed, because the traffic quality differs that much. Cheap impressions that don’t convert aren’t a bargain. They’re a slower way to spend the same money.
If I had to pick one lever for a business just starting out, it’s landing page quality, not ad creative. Advertisers spend weeks testing hooks and audiences while their checkout flow quietly doubles their cost per acquisition. Fix what happens after the click first.
— Ruthwik
Let Courimo Handle Your Instagram Ad Strategy
Running the tests above takes weekly attention: rotating creative, watching CTR drop before it costs you money, and adjusting bids before a campaign drifts past its target CPA. Courimo’s social media management team handles exactly that cadence for small and medium businesses that don’t have a full time media buyer on staff, pairing paid campaign management with the creative testing this guide walks through.
The agency’s pay per click advertising services extend beyond Instagram into the broader paid media mix, so budget and messaging stay consistent across platforms rather than fragmented across five different dashboards. If your current CPA is climbing and you’re not sure whether the problem is creative, audience, or your landing page, that diagnosis is exactly where an outside set of eyes tends to save the most money.
Request a free strategy session to get a clear read on where your Instagram budget is actually going and what a realistic monthly spend looks like for your specific goals.
Sources
- Facebook and Instagram Ads: Budgets, Costs & Schedules
- Instagram Advertising Costs in 2026: CPM, CPC & CPA Benchmarks
- Instagram ads: Everything you need to know in 2026
- Instagram Advertising Cost 2026: Full Pricing Breakdown
- How Much Do Instagram Ads Cost in 2026? | WordStream